
What Fall Actually Looks Like in the Conejo Valley Housing Market
Fall in the Conejo Valley is not a slowdown — it is a change in who is in the room. Across Westlake Village, Thousand Oaks, Newbury Park, Agoura Hills and Oak Park, single-family homes are closing at medians between $1.14M and $1.90M so far in 2026, there is roughly 3.3 months of supply on the market, and homes are taking 40 to 57 days to sell. What actually changes in autumn is the pace, not the volume.
About these numbers. Source: Flexmls / VCRDS closed-sale data for the Conejo Simi Moorpark Association of REALTORS® MLS, pulled August 24, 2026. Single-family residences unless noted. Figures reflect transactions reported to this MLS. Deemed reliable but not guaranteed.
Where the Conejo Valley market stands going into fall 2026
| City | Homes for sale (Aug 24, 2026) |
Homes for sale (Aug 24, 2025) |
Closed sales, last 12 months |
Months of supply |
|---|---|---|---|---|
| Westlake Village | 42 | 58 | 158 | 3.2 |
| Thousand Oaks | 92 | 92 | 300 | 3.7 |
| Newbury Park | 50 | 68 | 237 | 2.5 |
| Agoura Hills | 33 | 33 | 84 | 4.7 |
| Oak Park | 15 | 20 | 64 | 2.8 |
| Five-city total | 232 | 271 | 843 | 3.3 |
Two things stand out. First, inventory is genuinely tight: 232 single-family homes were on the market across the five cities on August 24, 2026, down from 271 on the same date in 2025 — about 14% fewer choices for buyers. Second, closings went up over that same stretch. The trailing twelve months produced 843 closed single-family sales versus 799 in the twelve months before that, a gain of roughly 5%.
Months of supply is the number I watch most closely, because it describes how long it would take to sell everything currently listed at the current pace. Under about four months has historically behaved like a seller-leaning market in this valley. Newbury Park (2.5) and Oak Park (2.8) are the tightest. Agoura Hills (4.7) is the loosest of the five, and it is the one place where a buyer currently has meaningfully more to choose from relative to how fast homes are actually selling.


Four years of the same window, city by city
Year-over-year comparisons only mean something if the calendar window is identical, so every table below covers January 1 through August 24 — the same 7.8 months in 2023, 2024, 2025 and 2026. That removes the seasonal distortion you get from comparing a full year against a partial one.
| Westlake Village — single-family, Jan 1 to Aug 24 | 2023 | 2024 | 2025 | 2026 |
|---|---|---|---|---|
| Homes closed | 123 | 94 | 106 | 119 |
| Median sale price | $1,850,000 | $1,823,750 | $1,986,750 | $1,900,000 |
| Average sale price | $2,299,104 | $2,525,129 | $2,434,399 | $2,463,267 |
| Avg. days on market (sold) | 44 | 50 | 59 | 57 |
| Sale-to-list ratio | 99% | 99% | 98% | 97% |
| Thousand Oaks — single-family, Jan 1 to Aug 24 | 2023 | 2024 | 2025 | 2026 |
|---|---|---|---|---|
| Homes closed | 197 | 173 | 235 | 193 |
| Median sale price | $1,089,000 | $1,210,000 | $1,304,000 | $1,200,000 |
| Average sale price | $1,213,636 | $1,496,485 | $1,648,662 | $1,442,884 |
| Avg. days on market (sold) | 38 | 44 | 38 | 40 |
| Sale-to-list ratio | 101% | 101% | 99% | 99% |
| Newbury Park — single-family, Jan 1 to Aug 24 | 2023 | 2024 | 2025 | 2026 |
|---|---|---|---|---|
| Homes closed | 117 | 117 | 113 | 154 |
| Median sale price | $1,100,000 | $1,150,000 | $1,175,000 | $1,143,500 |
| Average sale price | $1,201,743 | $1,271,163 | $1,338,446 | $1,262,925 |
| Avg. days on market (sold) | 38 | 36 | 50 | 42 |
| Sale-to-list ratio | 101% | 100% | 99% | 99% |
| Agoura Hills — single-family, Jan 1 to Aug 24 | 2023 | 2024 | 2025 | 2026 |
|---|---|---|---|---|
| Homes closed | 42 | 56 | 44 | 49 |
| Median sale price | $1,420,000 | $1,387,792 | $1,547,000 | $1,495,000 |
| Average sale price | $1,644,722 | $1,667,675 | $1,777,631 | $1,711,414 |
| Avg. days on market (sold) | 37 | 49 | 50 | 55 |
| Sale-to-list ratio | 100% | 99% | 99% | 98% |
| Oak Park — single-family, Jan 1 to Aug 24 | 2023 | 2024 | 2025 | 2026 |
|---|---|---|---|---|
| Homes closed | 26 | 22 | 45 | 42 |
| Median sale price | $1,210,000 | $1,285,000 | $1,225,000 | $1,276,450 |
| Average sale price | $1,453,192 | $1,420,435 | $1,393,321 | $1,409,938 |
| Avg. days on market (sold) | 40 | 40 | 38 | 44 |
| Sale-to-list ratio | 99% | 99% | 98% | 99% |
Read across the median rows and a consistent pattern shows up: 2025 was the high-water mark in most of these cities, 2026 has come in slightly below it, and 2026 is still above 2023. Thousand Oaks is the clearest example — a median of $1,089,000 in 2023, peaking at $1,304,000 in 2025, and $1,200,000 so far in 2026. Oak Park is the exception that moved the other way, with its 2026 median ($1,276,450) above both 2025 and 2024.
The row I would not skip is days on market. Every one of the five cities is selling more slowly than it did in 2023. Westlake Village went from an average of 44 days to 57, and Agoura Hills from 37 to 55. Sale-to-list ratios drifted down alongside it — Newbury Park and Thousand Oaks were both closing above list on average in 2023 (101%) and are now at 99%. Homes are still selling. They are just no longer selling instantly, and the first asking price is no longer the final number as often as it was.
What the fall window itself actually looks like
Now the part that is specific to this article. Below is the September 1 to November 30 window — actual autumn — for the last four years.
| Westlake Village — single-family, Sep 1 to Nov 30 (the fall window) | 2022 | 2023 | 2024 | 2025 |
|---|---|---|---|---|
| Homes closed | 35 | 40 | 54 | 24 |
| Median sale price | $1,550,000 | $1,667,500 | $1,875,000 | $1,675,000 |
| Avg. days on market (sold) | 46 | 50 | 65 | 72 |
| Thousand Oaks — single-family, Sep 1 to Nov 30 (the fall window) | 2022 | 2023 | 2024 | 2025 |
|---|---|---|---|---|
| Homes closed | 86 | 68 | 76 | 73 |
| Median sale price | $1,055,500 | $1,082,500 | $1,130,000 | $1,200,000 |
| Avg. days on market (sold) | 42 | 35 | 40 | 55 |
| Newbury Park — single-family, Sep 1 to Nov 30 (the fall window) | 2022 | 2023 | 2024 | 2025 |
|---|---|---|---|---|
| Homes closed | 46 | 45 | 35 | 65 |
| Median sale price | $945,000 | $1,159,000 | $1,070,000 | $1,120,000 |
| Avg. days on market (sold) | 54 | 41 | 47 | 52 |
| Agoura Hills — single-family, Sep 1 to Nov 30 (the fall window) | 2022 | 2023 | 2024 | 2025 |
|---|---|---|---|---|
| Homes closed | 17 | 10 | 14 | 29 |
| Median sale price | $1,060,000 | $1,552,500 | $1,255,000 | $1,550,000 |
| Avg. days on market (sold) | 37 | 87 | 51 | 62 |
| Oak Park — single-family, Sep 1 to Nov 30 (the fall window) | 2022 | 2023 | 2024 | 2025 |
|---|---|---|---|---|
| Homes closed | 8 | 11 | 6 | 16 |
| Median sale price | $1,215,000 | $1,399,000 | $1,245,000 | $1,540,000 |
| Avg. days on market (sold) | 42 | 47 | 26 | 55 |
The volume story is not what most people assume. Add the five cities together and fall produced 192 closed single-family sales in 2022, 174 in 2023, 185 in 2024 and 207 in 2025. In 2025 those five cities averaged about 70 closings per month from January through August — and about 69 per month during September, October and November. On a per-month basis, autumn closed at essentially the same rate as the rest of the year.
The pace story is real, though. Days on market climbs in the fall almost everywhere. Westlake Village averaged 59 days on market for homes sold January through August 2025, and 72 days for homes sold that fall. Thousand Oaks went from 38 to 55. Oak Park went from 38 to 55. That is the honest version of the seasonal effect: roughly the same number of transactions, taking noticeably longer to put together.
Fall medians also bounce around a lot more, and the reason is sample size. Oak Park closed six single-family homes in fall 2024 and sixteen in fall 2025. When a quarter turns on six sales, the median is telling you about those six houses, not about the neighborhood. Small-sample quarters are worth reading with that in mind — which is exactly why I publish the counts next to the prices instead of just the prices.
Condos and townhomes
The attached-home market is a much smaller slice of the valley, and it moves on its own schedule. Here is the trailing twelve months.
| City | Condos & townhomes closed, last 12 months |
Median sale price | Avg. days on market |
|---|---|---|---|
| Westlake Village | 35 | $690,000 | 70 |
| Thousand Oaks | 36 | $492,000 | 73 |
| Newbury Park | 10 | $742,500 | 46 |
| Agoura Hills | 8 | $536,500 | 66 |
| Oak Park | 15 | $490,000 | 79 |
Two notes. Attached-home volume is small enough in Agoura Hills and Newbury Park that a single unusual sale visibly moves the median, so treat those two rows as directional rather than precise. And days on market is consistently longer for attached homes than for single-family across the board — 66 to 79 days in four of the five cities. HOA document review, lender condo approval and, increasingly, HOA insurance questions all add real time to these escrows.
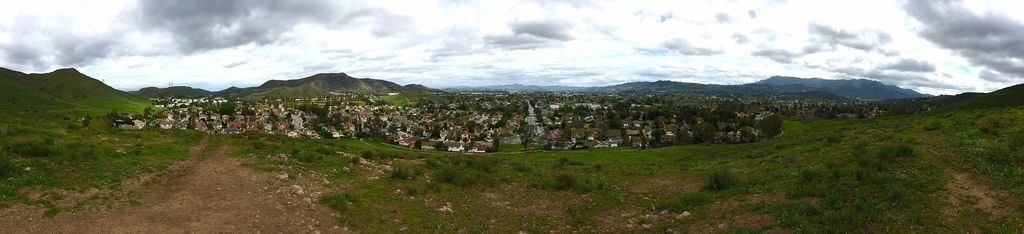

It is not one market — it is five
Lumping the Conejo Valley together is the most common analytical mistake I see, and the tables above are the argument against it. The seasonal curve genuinely differs by community.
- Oak Park is the most school-driven and most seasonal submarket in the valley. It is small, inventory is limited (15 homes listed as of late August), and buyers are overwhelmingly targeting Oak Park Unified. Sharp spring, quiet late fall, and a median that swings hard on low volume.
- Agoura Hills is similarly district-driven through Las Virgenes Unified, with a pronounced seasonal curve — and at 4.7 months of supply it is currently the softest of the five on a supply basis.
- Newbury Park is the volume leader right now, with 154 closings through August 2026 — more than any of the four prior years and 2.5 months of supply. Dos Vientos skews family-oriented, larger and more seasonal; the older inventory closer to the 101 stays more liquid because it draws first-time buyers and relocations.
- Thousand Oaks is the deepest and most varied market, which makes it the least uniform. Entry-level and mid-range segments hold up into November; the upper end thins noticeably after October.
- Westlake Village is a smaller, higher-price market — a $1.9M median against roughly $1.2M in Thousand Oaks — with a large share of move-up and downsizing activity. That decouples it somewhat from the school calendar, but its fall days-on-market is the longest of the five.
Two fall-specific frictions worth planning for
Insurance. Fall is peak fire season here, and insurability has become a genuine transaction issue on hillside and open-space-adjacent properties across the valley. Get quotes early rather than after inspections. Sellers who can hand over documented mitigation — cleared Zone 0, roof condition, arborist work — have a real advantage. See my guide to fire hazard zones, brush clearance and insurance.
The holiday compression. Escrows that open in mid-December run into appraiser, lender and county-recorder holiday schedules. The data already shows autumn transactions taking longer; December compounds it. Build in extra days rather than assuming a standard timeline.
All of these figures describe the market as of late August — the inventory itself moves daily. See every home currently for sale across the Conejo Valley, or browse recent sales to see what is actually closing.
Frequently asked questions
Does the Conejo Valley housing market slow down in the fall?
Not in the way most people expect. Closed single-family sales across Westlake Village, Thousand Oaks, Newbury Park, Agoura Hills and Oak Park totaled 207 in fall 2025 (September through November) — roughly 69 per month, essentially the same monthly pace as January through August of that year. What does change is speed: average days on market rose from 59 to 72 in Westlake Village and from 38 to 55 in Thousand Oaks over the same comparison.
What is the median home price in the Conejo Valley right now?
There is no single number, and that is the point. Through August 24, 2026, median single-family sale prices were $1,900,000 in Westlake Village, $1,495,000 in Agoura Hills, $1,276,450 in Oak Park, $1,200,000 in Thousand Oaks and $1,143,500 in Newbury Park.
Is there enough inventory in the Conejo Valley?
Inventory is tight by historical standards. There were 232 single-family homes listed across the five cities on August 24, 2026, down about 14% from 271 a year earlier, which works out to roughly 3.3 months of supply valley-wide. Newbury Park (2.5 months) and Oak Park (2.8) are tightest; Agoura Hills (4.7) has the most relative choice.
Are homes still selling above asking price?
Less often than in 2023. Newbury Park and Thousand Oaks both averaged 101% of list price in the January–August window of 2023; both are at 99% in 2026. Westlake Village has moved from 99% to 97% over the same period.
Which Conejo Valley city has the most fall activity?
Thousand Oaks, by volume — it closed 73 single-family sales in fall 2025, more than any other city in the group. Newbury Park was second at 65, and it is the only one of the five where fall 2025 volume nearly doubled the prior fall.
Where do these numbers come from?
Source: Flexmls / VCRDS closed-sale data for the Conejo Simi Moorpark Association of REALTORS® MLS, pulled August 24, 2026. Single-family residences unless noted. Figures reflect transactions reported to this MLS. Deemed reliable but not guaranteed. I refresh this table every quarter rather than quoting county-level or national figures, because neither describes what is happening on your street.
I pull these numbers myself every quarter, city by city, instead of repeating a headline about the “California market.” If you want to know what your specific street looks like — not the valley average — start with a home valuation or just send me a note. I am glad to walk through the comparable sales with you whether or not you are anywhere near making a move.
Explore the areas in this report: Westlake Village · Thousand Oaks · Newbury Park · Agoura Hills · Oak Park